Want to analyse AWS MSK Broker logs
Stack trace used :
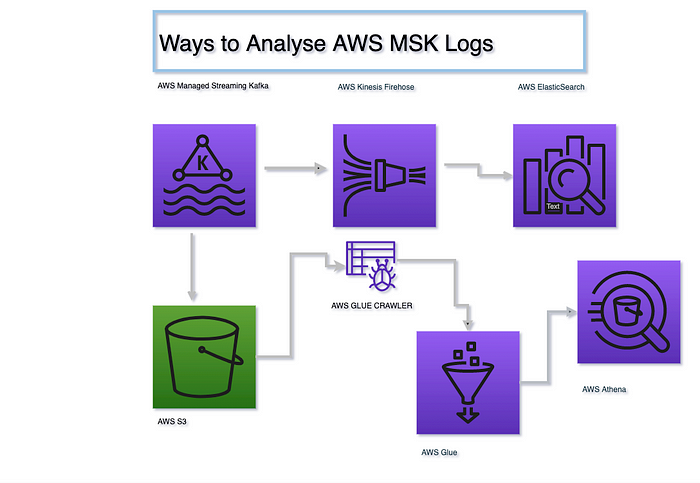
AWS MSK log delivering to S3 using Kinesis Firehose
AWS Glue
AWS Athena
AWS Elastic search
Architecture to Follow :

Use Case 1 :
Analysing AWS MSK logs through Athena queries.
Steps :
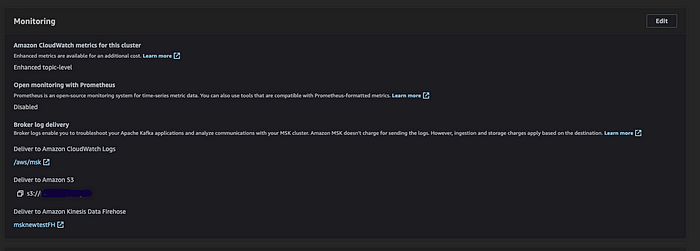
- Create a MSK cluster. Under Monitoring section, select the Edit under monitoring to point to a S3 folder

2. Once you have the S3 configured, You would start seeing logs, getting into S3. Now we need to go to the AWS Glue and use Glue crawler to create a schema.
3. Go to AWS Glue and click, Click on Create DataBase and create DataBase.Now, we need to create connection a connection which would be used by crawler.
Select Database name -> created earlier
Connection Type -> Network
VPC -> Same as MSK VPC and subnetIDs
Finish
4. Now we need to create a Crawler, Choose S3 folder which is MSK s3 log folder. Select, connection which is created earlier.
Note : Make sure that you have a S3 vpc endpoint in the VPC selected for crawler else it would fail.
5. Once crawler is created, run Crawler and wait for Crawler to get finished.
Our set up is ready to be analysed by Athena.
Steps
- Go to AWS Athena.
- You would see, database and table name. Table name is selected based on the s3 folder location that you have given.
- Run queries such as :
SELECT * FROM “msk-database-new”.”2021" limit 10
SELECT * FROM “msk-database-new”.”2021" where raw_log LIKE ‘%INFO%’
SELECT broker_id, approximate_event_timestamp, raw_log FROM “msk-database-new”.”2021" where raw_log LIKE ‘%INFO%’
SELECT broker_id, approximate_event_timestamp, raw_log FROM “msk-database-new”.”2021" where raw_log LIKE ‘%WARN%’
SELECT broker_id, approximate_event_timestamp, raw_log FROM “msk-database-new”.”2021" where raw_log LIKE ‘%error%’
Use Case 2:
Analysing logs through Elastic search :
Steps :
- First of all, we need to create an Elastic search domain. You can create the Firehose outside VPC or in VPC(Make sure to keep it in the same VPC as MSK)
https://docs.aws.amazon.com/elasticsearch-service/latest/developerguide/es-gsg-create-domain.html
2. Now, We will have to create a Firehose stream which would be configured to deliver logs to Elasticsearch.
https://docs.aws.amazon.com/firehose/latest/dev/basic-create.html
3. Once the above two set up is completed, Your logs would start flowing through MSK logs to Firehose and then to Elasticsearch. This can then be visualised through Kibana.
Troubleshooting:
If you do not see logs in Elasticsearch, First of all, You need to check whether data is flowing to Firehose stream. This can be checked through IncomingRecords or IncomingBytes metrics of Firehose.
If you do not see metrics there, check the log of Firehose o cloudwatch which would be under, /aws/firehose/<delivery-stream-name>
Once you see data into Firehose, check the logs of Elasticsearch and its metrics.
